Established as a Z_GIS research area in 2021, our research in EO Analytics focuses on multi-scale and multi-purpose big EO data applications and their challenges, focusing primarily on free and open data archives (e.g. Copernicus) and integrating geographic information and objects into big EO data analytics. We aim towards automated semantic image understanding, combined spatial and temporal analysis in large imagery databases, and improved exploration and understanding of uncertainty and inhomogeneity in coverage and quality inherent to global EO archives and analysis. Combining advances in the fields of geography, image understanding, remote sensing, image processing, computer vision, spatial analysis and computer science, we endeavour to develop a collection of adaptive, interdisciplinary solutions necessary to approach challenges posed by big EO data from different angles and application perspectives.

Find us on LinkedIn: LinkedIn: https://www.linkedin.com/company/eo-analytics-lab
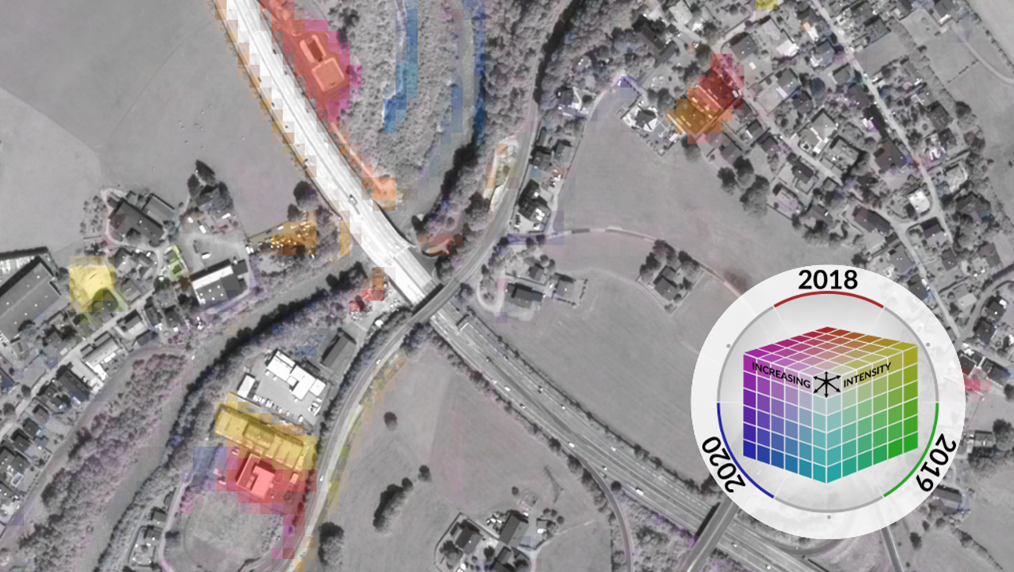
Multi-temporal RGB change layer revealing changes in between three different years generated using the sen2cube.at system. Image bands contain analysis of counted vegetation observations within the period of 15. April – 31. October (R = 2018, G = 2019, B = 2020). Red colours indicate for vegetation decrease in 2019, yellow a vegetation decrease in 2020, purple and dark blue a vegetation increase “re-greening” in the year 2020, light blue re-greening in the year 2019, green increase of vegetation in 2019 but again loss in 2020. 
Multi-temporal RGB change layer revealing changes in between three different years generated using the  sen2cube.at system. Image bands contain analysis of counted vegetation observations within the period of 15. April – 31. October (R = 2018, G = 2019, B = 2020). Red colours indicate for vegetation decrease in 2019, yellow a vegetation decrease in 2020, purple and dark blue a vegetation increase “re-greening” in the year 2020, light blue re-greening in the year 2019, green increase of vegetation in 2019 but again loss in 2020. 


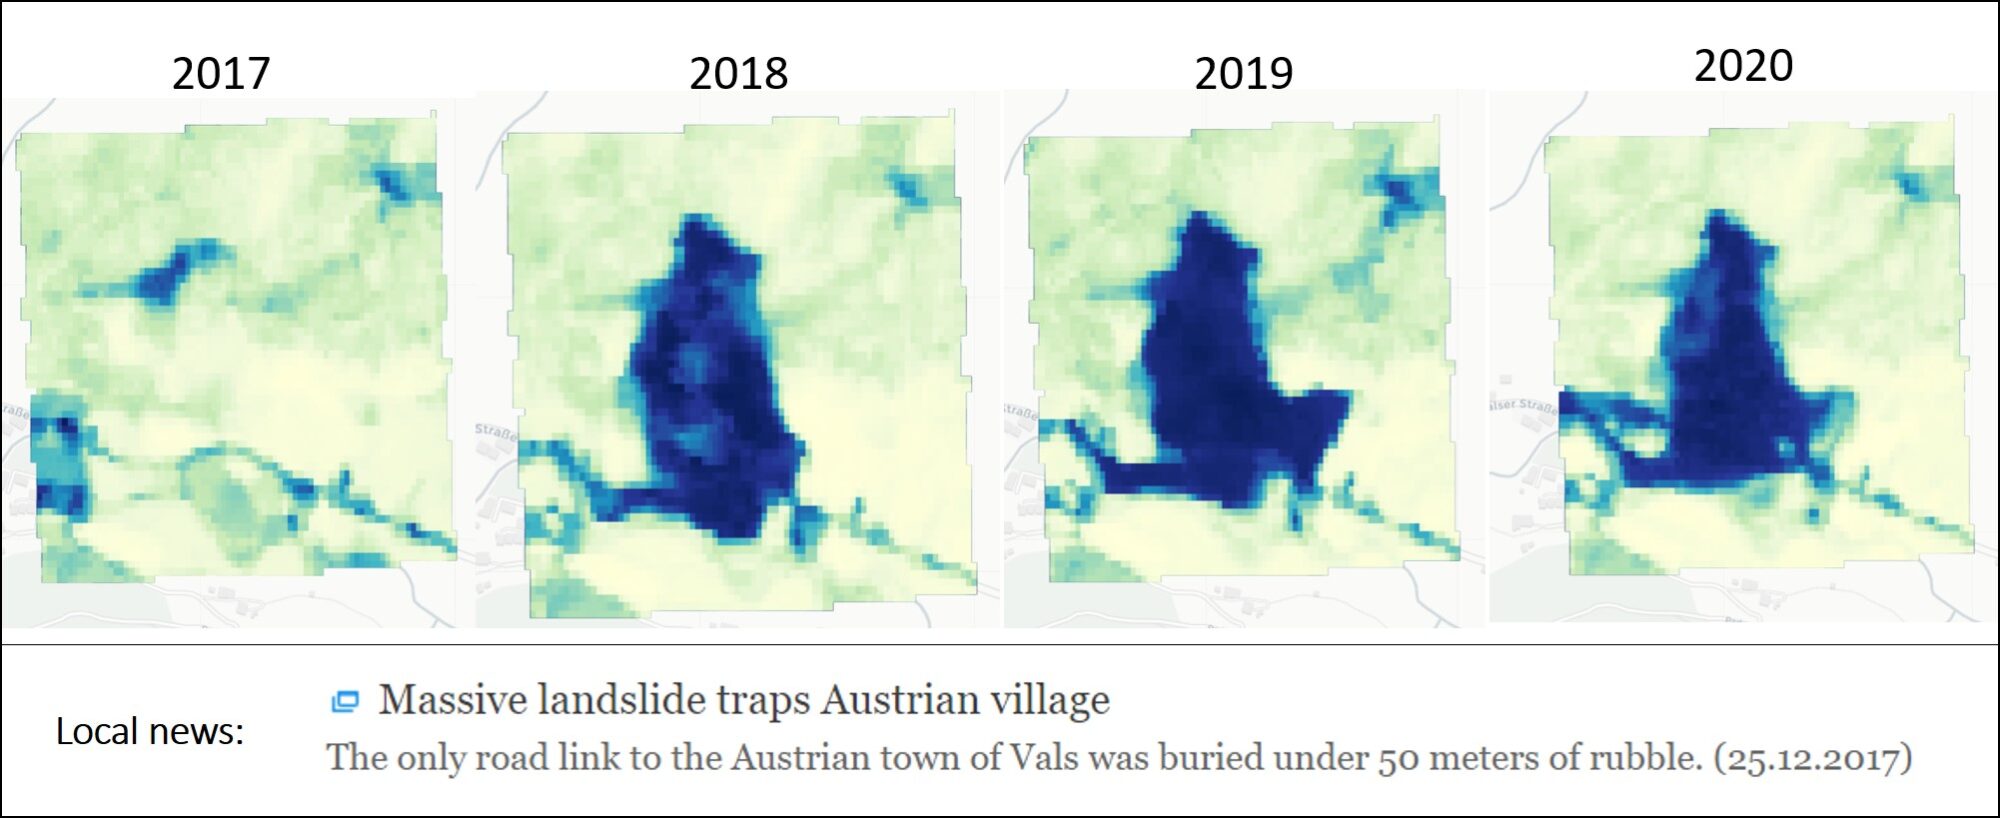
Landslide detection based on semantically enriched Sentinel-2 imagery from 2017-2020.
This land cover change related to a landslide near the Austrian town of Vals in 2017 can be queried and made visible for multiple years using the  sen2cube.at system developed here at the EO Analytics research group based on Sentinel-2 imagery with 10m spatial resolution. Semantic query and figure by Larisa Paulescu, 2021.